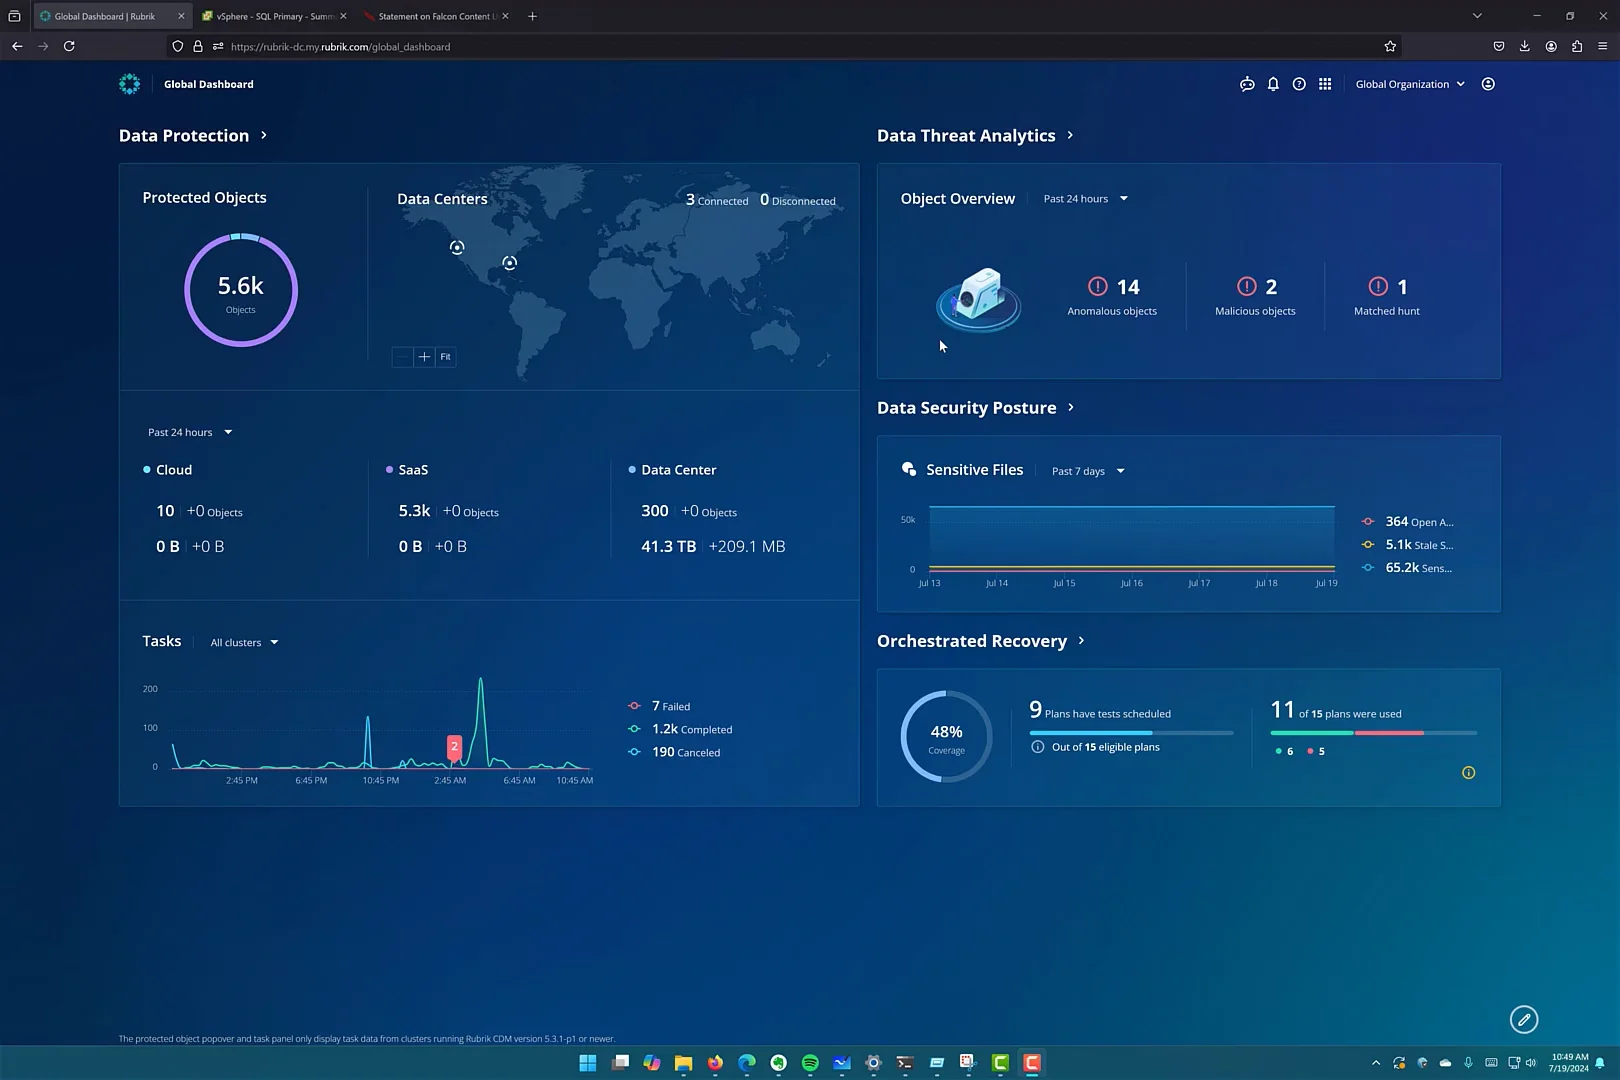
A homelab without monitoring is just a collection of servers you hope will keep working. The problem most people face is not a lack of tools; it is too many tools that do not talk to each other. CPU usage on Proxmox, Docker container stats, disk space on the NAS, and uptime for public services all end up in different dashboards or worse, in your head.
This guide focuses on a practical monitoring stack using tools that run easily on a homelab server: Glances for per-host metrics, cAdvisor for container metrics, Prometheus for time-series storage, and Grafana for visualization. The goal is a unified view without enterprise complexity.
Start With Glances for Per-Host Monitoring
Glances is a cross-platform system monitoring tool written in Python. It shows CPU, memory, disk, network, and process metrics in a terminal or web interface. Unlike top or htop, Glances automatically detects metrics and works on Linux, macOS, and Windows.
Install Glances with pip or your package manager. Run it in server mode with glances -w to expose a web interface on port 61208. You can query individual metrics with its REST API or push them to Prometheus with the glances-e exporter.
For a quick setup, run Glances on every Proxmox node and LXC container you want to monitor. It is lightweight and does not require a database.
Add cAdvisor for Container Metrics
cAdvisor collects resource usage and performance metrics for running containers. It exposes CPU, memory, filesystem, and network stats in a format Prometheus can scrape.
Deploy cAdvisor as a Docker container. It needs access to the host filesystem and Docker socket, so mount /var/run/docker.sock and /sys and /var/lib/docker as volumes. The default scrape port is 8080.
cAdvisor automatically discovers all containers on the host. It groups metrics by container name and Docker label. If you use Docker Compose, label your services for better grouping in Grafana.
Store Metrics in Prometheus
Prometheus is a time-series database designed for monitoring. It scrapes metrics from Glances, cAdvisor, and other exporters at regular intervals. The data stays local unless you configure remote storage.
Install Prometheus on a dedicated VM or LXC container. Use a minimal prometheus.yml configuration with scrape jobs for Glances and cAdvisor. Set a retention period that matches your storage capacity. Thirty days is usually enough for homelab trend analysis.
Add node_exporter to every host you want to monitor. Node exporter collects hardware and OS metrics: CPU, memory, disk, network, and systemd service status. Prometheus scrapes node exporter on each host, then you can correlate Proxmox node metrics with VM metrics in Grafana.
Visualize in Grafana
Grafana turns Prometheus data into dashboards. You do not need to build dashboards from scratch. Import community dashboards for Glances, cAdvisor, node exporter, and Proxmox. Dashboard IDs 1860, 179, and 10619 are popular starting points.
Create a homelab overview dashboard with panels for:
– CPU usage per Proxmox node
– Memory usage per VM and LXC container
– Disk usage and inode usage
– Network throughput per host and container
– Docker container uptime and restart count
– Alert status for failed services
Set up a second dashboard for application-specific metrics if you run databases, web servers, or media tools.
Alerting With Alertmanager
Grafana alerts are good for simple thresholds. For more complex routing, install Alertmanager alongside Prometheus. Alertmanager groups alerts, silences noisy notifications, and routes messages to email, Telegram, or Discord webhooks.
Define alert rules in Prometheus for critical conditions: disk usage above 85 percent, memory usage above 90 percent, node exporter unreachable for more than five minutes, or a container restarting repeatedly.
Alternative: Uptime Kuma for Service Monitoring
Prometheus and Grafana are great for infrastructure metrics, but they do not tell you if a website or API is actually responding. Uptime Kuma fills that gap with TCP, HTTP, ping, and DNS checks.
Deploy Uptime Kuma as a Docker container. Add monitors for your public services: WordPress sites, Nextcloud, media servers, and VPN endpoints. Uptime Kuma sends notifications to Telegram, Slack, or email when a service goes down.
Stack Comparison
| Tool | Purpose | Resource Usage | Best For |
|---|---|---|---|
| Glances | Per-host metrics | Low | Quick server overview |
| cAdvisor | Container metrics | Low | Docker and Podman stats |
| Node Exporter | Hardware metrics | Low | Prometheus scrape target |
| Prometheus | Time-series database | Medium | Historical metrics and alerts |
| Grafana | Visualization | Medium | Dashboards and reporting |
| Alertmanager | Alert routing | Low | Notifications and grouping |
| Uptime Kuma | Uptime checks | Low | HTTP, TCP, and ping monitoring |
Deployment Tips
Run Prometheus and Grafana on a dedicated VM with at least 2 CPU cores and 4 GB of RAM. Store Prometheus data on an SSD for faster queries. Use Docker Compose to deploy cAdvisor, Uptime Kuma, and exporters consistently across hosts.
Secure Grafana with authentication and HTTPS behind a reverse proxy. Do not expose Prometheus or Grafana directly to the internet without a VPN or reverse proxy.
Final Thoughts
A good monitoring stack does not need to be perfect on day one. Start with Glances and cAdvisor. Add Prometheus and Grafana when you want historical data. Add Alertmanager and Uptime Kuma when you need alerts. The stack grows with your homelab.
If you want to secure the servers you are monitoring, read our guide on homelab security hardening and Docker networking for homelabs.
Related Posts
- Best Self Hosted Backup Solutions For Homelab Restic Borg Duplicati Kopia And Proxmox Pbs
- Home Server Security Hardening Practical Steps To Protect Your Linux And Proxmox Setup
- Docker Networking For Homelab Bridge Compose And Ports Done Right
- Self Hosted Github Actions Runner On Linux
- Offsite Backup For Homelab S3 Vs Backblaze B2 Vs Cloudflare R2 Compared